- Course Details
- Course Outline
- Training Deliverables
Course Description
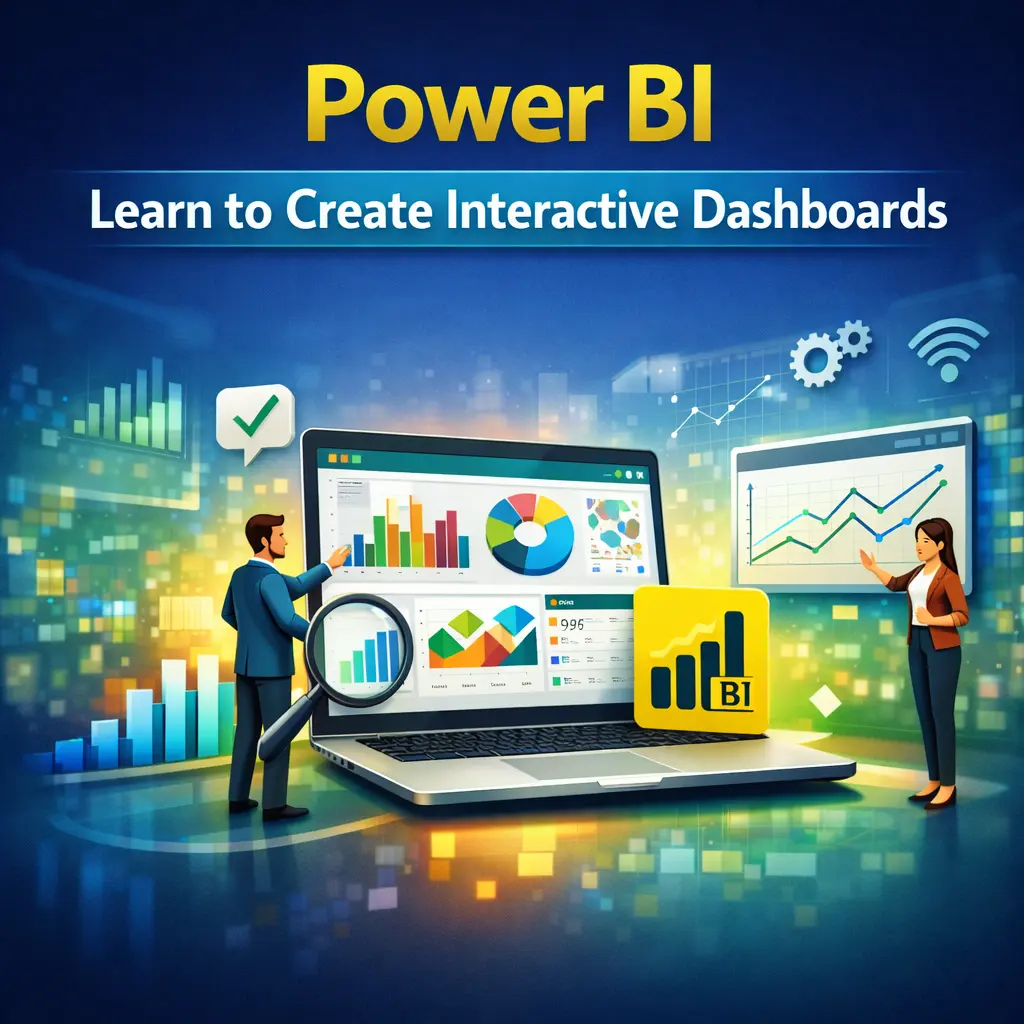
This Power BI Training course is designed to help professionals transform raw data into meaningful business insights using Microsoft Power BI. Participants will learn how to connect to multiple data sources, clean and transform data, build data models, create interactive dashboards, write DAX formulas, and publish reports to the Power BI Service.
The training is highly practical and hands-on, focusing on real-world business scenarios that enable participants to build professional dashboards and make data-driven decisions with confidence.
Learning Objectives
By the end of this course, participants will be able to:
- Understand the Power BI ecosystem and architecture.
- Connect to multiple data sources.
- Clean and transform data using Power Query.
- Build efficient data models and relationships.
- Create calculated columns and DAX measures.
- Perform business analysis using Time Intelligence.
- Design interactive dashboards and reports.
- Create KPI cards, charts, maps, and visualizations.
- Publish, share, and manage reports in Power BI Service.
- Leverage AI features such as Copilot, ChatGPT, and AI Visuals for faster report development.
Who Should Attend?
This course is ideal for:
- Business Analysts
- Data Analysts
- Finance & Accounting Professionals
- HR Professionals
- Sales & Marketing Teams
- Operations & Supply Chain Professionals
- MIS Executives
- Managers & Team Leaders
- Anyone looking to build interactive dashboards and automate reporting using Power BI
Day 1 – Data Preparation & Data Modeling
Module 1: Introduction to Power BI
- Power BI Overview
- Power BI Desktop vs Power BI Service
- Power BI Architecture
- Installing Power BI Desktop
- Understanding the Power BI Interface
Module 2: Connecting to Data Sources
- Excel Files
- CSV Files
- SQL Server
- SharePoint
- Folder Connection
- Web Data Sources
Module 3: Power Query (Data Transformation)
- Power Query Editor
- Data Cleaning Techniques
- Remove Errors & Duplicates
- Split & Merge Columns
- Append Queries
- Merge Queries
- Creating Parameters
- Refreshing Data
Module 4: Data Modeling
- Creating Relationships
- One-to-One & One-to-Many Relationships
- Star Schema
- Snowflake Schema
- Date Table Creation
- Best Practices for Data Models
Module 5: Introduction to DAX
- Calculated Columns
- Measures
- Aggregation Functions
- IF Statements
- DIVIDE Function
- Variables (VAR)
- SelectedValue
- Common Business Calculations
Day 2 – Dashboard Development & Power BI Service
Module 6: Advanced DAX
- CALCULATE
- FILTER
- ALL & ALLEXCEPT
- SUMX
- AVERAGEX
- RANKX
- Time Intelligence (MTD, QTD, YTD)
- Running Total
- Dynamic Titles
- KPI Calculations
Module 7: Data Visualization
- KPI Cards
- Tables & Matrix
- Bar & Column Charts
- Line Charts
- Pie & Donut Charts
- Maps
- Treemap
- Waterfall Chart
- Scatter Chart
- Gauge Chart
- Decomposition Tree
- AI Visuals
Module 8: Interactive Dashboard Design
- Dashboard Layout Best Practices
- Slicers
- Sync Slicers
- Drill Down & Drill Through
- Bookmarks
- Buttons & Navigation
- Tooltips
- Conditional Formatting
- Mobile Layout
Module 9: Power BI Service
- Publishing Reports
- Creating Dashboards
- Workspaces
- Sharing Reports
- Scheduled Refresh
- Data Gateway
- Row Level Security (RLS)
- Exporting Reports
- Collaboration Features
Module 10: AI Features & Real-World Projects
- Microsoft Copilot in Power BI
- ChatGPT for DAX Formula Generation
- AI Prompt Writing Techniques
- Q&A Visual
- Smart Narrative
- Sales Dashboard
- HR Dashboard
- Finance Dashboard
- Executive KPI Dashboard
- Hands-on Project & Case Study
Training Deliverables
Participants will receive:
- Training Material / Course Manual
- Practice Datasets
- Power BI Project Files (.pbix)
- DAX Formula Reference Guide
- Power Query Cheat Sheet
- Dashboard Design Templates
- Certificate of Completion
- Post-Training Support & Q&A