
Mastering Excel
Course Details Course Outline Training Deliverables Course Description This Advanced Excel Training course is designed to help professionals master Excel’s powerful features for data analysis, reporting, automation, and decision-making. Participants will learn practical techniques to efficiently manage large datasets, create dynamic reports, automate repetitive tasks, and gain valuable business insights using advanced Excel tools and functions. The training is highly interactive and hands-on, with real-world business scenarios and exercises that participants can immediately apply in their workplace. Learning Objectives By the end of this course, participants will be able to: Organize and manage large datasets efficiently. Apply advanced formulas and functions to solve business problems. Perform data analysis using PivotTables and PivotCharts. Create professional dashboards and reports. Clean and transform data using Power Query. Use XLOOKUP and advanced lookup techniques. Apply Conditional Formatting for data visualization. Utilize data validation and data protection features. Automate repetitive tasks to improve productivity. Leverage AI tools such as ChatGPT, Microsoft Copilot, and Claude AI to enhance Excel productivity. Who Should Attend? This course is ideal for: Business Professionals Data Analysts Finance & Accounting Professionals HR Professionals Sales & Marketing Teams Operations & Administrative Staff Project Managers Anyone who regularly works with Excel and wants to improve efficiency and reporting skills Day 1 – Advanced Excel Fundamentals & Data Analysis Module 1: Excel Best Practices Working with Excel Tables Named Ranges Workbook Management Techniques Data Validation Module 2: Advanced Formulas & Functions IF, Nested IF, IFS SUMIFS, COUNTIFS, AVERAGEIFS TEXT Functions Date & Time Functions Logical Functions Module 3: Lookup & Reference Functions VLOOKUP HLOOKUP INDEX & MATCH XLOOKUP Dynamic References Module 4: Data Analysis & Reporting Sorting and Filtering Techniques Advanced Filter Subtotal Conditional Formatting Data Visualization Techniques Module 5: Pivot Tables & Pivot Charts Creating Pivot Tables Grouping Data Calculated Fields Slicers & Timelines Interactive Pivot Charts Day 2 – Automation, Dashboards & AI Productivity Module 6: Power Query for Data Transformation Importing Data from Multiple Sources Data Cleaning Techniques Merge Queries Append Queries Refreshing Automated Reports Module 7: Dashboard Design & Reporting Dashboard Planning KPI Metrics Interactive Reports Dynamic Charts Slicers & Controls Module 8: Advanced Excel Productivity Features What-If Analysis Goal Seek Scenario Manager Data Consolidation Workbook Protection Module 9: AI-Powered Excel Using ChatGPT for Excel Formulas Creating Reports with AI Assistance Microsoft Copilot in Excel Claude AI for Data Analysis AI Prompting Best Practices Module 10: Real-World Case Studies & Exercises Sales Analysis Dashboard HR Reporting Dashboard Financial Reporting Examples Interactive Business Reports Hands-on Practice Session Participants will receive: Training Material / Course Manual Practice Files & Exercises Excel Formula Reference Guide Certificate of Completion Post-Training Support & Q&A
Power BI
Course Details Course Outline Training Deliverables Course Description This Power BI Training course is designed to help professionals transform raw data into meaningful business insights using Microsoft Power BI. Participants will learn how to connect to multiple data sources, clean and transform data, build data models, create interactive dashboards, write DAX formulas, and publish reports to the Power BI Service. The training is highly practical and hands-on, focusing on real-world business scenarios that enable participants to build professional dashboards and make data-driven decisions with confidence. Learning Objectives By the end of this course, participants will be able to: Understand the Power BI ecosystem and architecture. Connect to multiple data sources. Clean and transform data using Power Query. Build efficient data models and relationships. Create calculated columns and DAX measures. Perform business analysis using Time Intelligence. Design interactive dashboards and reports. Create KPI cards, charts, maps, and visualizations. Publish, share, and manage reports in Power BI Service. Leverage AI features such as Copilot, ChatGPT, and AI Visuals for faster report development. Who Should Attend? This course is ideal for: Business Analysts Data Analysts Finance & Accounting Professionals HR Professionals Sales & Marketing Teams Operations & Supply Chain Professionals MIS Executives Managers & Team Leaders Anyone looking to build interactive dashboards and automate reporting using Power BI Day 1 – Data Preparation & Data Modeling Module 1: Introduction to Power BI Power BI Overview Power BI Desktop vs Power BI Service Power BI Architecture Installing Power BI Desktop Understanding the Power BI Interface Module 2: Connecting to Data Sources Excel Files CSV Files SQL Server SharePoint Folder Connection Web Data Sources Module 3: Power Query (Data Transformation) Power Query Editor Data Cleaning Techniques Remove Errors & Duplicates Split & Merge Columns Append Queries Merge Queries Creating Parameters Refreshing Data Module 4: Data Modeling Creating Relationships One-to-One & One-to-Many Relationships Star Schema Snowflake Schema Date Table Creation Best Practices for Data Models Module 5: Introduction to DAX Calculated Columns Measures Aggregation Functions IF Statements DIVIDE Function Variables (VAR) SelectedValue Common Business Calculations Day 2 – Dashboard Development & Power BI Service Module 6: Advanced DAX CALCULATE FILTER ALL & ALLEXCEPT SUMX AVERAGEX RANKX Time Intelligence (MTD, QTD, YTD) Running Total Dynamic Titles KPI Calculations Module 7: Data Visualization KPI Cards Tables & Matrix Bar & Column Charts Line Charts Pie & Donut Charts Maps Treemap Waterfall Chart Scatter Chart Gauge Chart Decomposition Tree AI Visuals Module 8: Interactive Dashboard Design Dashboard Layout Best Practices Slicers Sync Slicers Drill Down & Drill Through Bookmarks Buttons & Navigation Tooltips Conditional Formatting Mobile Layout Module 9: Power BI Service Publishing Reports Creating Dashboards Workspaces Sharing Reports Scheduled Refresh Data Gateway Row Level Security (RLS) Exporting Reports Collaboration Features Module 10: AI Features & Real-World Projects Microsoft Copilot in Power BI ChatGPT for DAX Formula Generation AI Prompt Writing Techniques Q&A Visual Smart Narrative Sales Dashboard HR Dashboard Finance Dashboard Executive KPI Dashboard Hands-on Project & Case Study Training Deliverables Participants will receive: Training Material / Course Manual Practice Datasets Power BI Project Files (.pbix) DAX Formula Reference Guide Power Query Cheat Sheet Dashboard Design Templates Certificate of Completion Post-Training Support & Q&A
PowerPoint
Course Details Course Outline Training Deliverables Course Description This Microsoft PowerPoint Training course is designed to help professionals create impactful, engaging, and visually appealing presentations for business meetings, training sessions, sales pitches, and executive reporting. Participants will learn how to design professional slides, use advanced formatting techniques, create infographics, apply animations effectively, and deliver presentations with confidence. The training is highly practical and hands-on, with real-world business presentation exercises that participants can immediately apply in their workplace. Learning Objectives By the end of this course, participants will be able to: Create professional business presentations from scratch. Design visually appealing slides using best design principles. Apply themes, templates, and Slide Masters for consistency. Create diagrams, infographics, and SmartArt graphics. Insert and format charts, tables, images, icons, and videos. Use animations and transitions effectively without overusing effects. Deliver interactive presentations using Presenter View. Create reusable presentation templates for the organization. Collaborate and review presentations with team members. Leverage AI tools such as Microsoft Copilot, ChatGPT, and Designer AI to create presentations faster. Who Should Attend? This course is ideal for: Business Professionals Managers & Team Leaders Sales & Marketing Teams Trainers & Educators HR Professionals Project Managers Business Analysts Consultants Anyone who creates presentations for meetings, training, or client presentations Day 1 – Presentation Design & Visual Communication Module 1: Introduction to Microsoft PowerPoint Understanding the PowerPoint Interface Creating and Managing Presentations Slide Layouts Themes & Templates Presentation Best Practices Module 2: Professional Slide Design Design Principles Color Combinations Typography Alignment & Consistency Slide Formatting Techniques Using Design Ideas (Designer) Module 3: Working with Objects Shapes Icons Pictures Stock Images SVG Graphics Tables Charts Screenshots 3D Models Module 4: SmartArt & Infographics Process Diagrams Organizational Charts Timeline Graphics Cycle Diagrams Pyramid & Matrix Creating Business Infographics Module 5: Slide Master & Templates Understanding Slide Master Creating Company Templates Headers & Footers Logos & Branding Custom Themes Reusable Presentation Templates Day 2 – Advanced Features, Animation & AI Productivity Module 6: Animations & Transitions Entrance, Emphasis & Exit Animations Motion Paths Animation Pane Trigger Animations Morph Transition Zoom Feature Professional Animation Techniques Module 7: Multimedia & Interactive Presentations Audio Video Screen Recording Hyperlinks Action Buttons Interactive Navigation Kiosk Presentations Module 8: Presenting Like a Professional Presenter View Presenter Notes Rehearse Timings Record Presentation Slide Show Settings Export to PDF & Video Printing Handouts Module 9: AI-Powered PowerPoint Microsoft Copilot for Presentations ChatGPT for Presentation Content AI Prompt Writing Best Practices Microsoft Designer AI Image Generation Creating Presentations Faster with AI Module 10: Real-World Business Projects Executive Business Presentation Sales Pitch Deck Training Presentation Project Status Presentation Business Proposal Team Presentation Hands-on Practice & Case Studies Training Deliverables Participants will receive: Training Material / Course Manual Practice Files & Exercises Professional Presentation Templates Business Icons & Infographic Resources Presentation Design Best Practices Guide Certificate of Completion Post-Training Support & Q&A
Power Query
Course Details Course Outline Training Deliverables Course Description This Excel Power Query Training course is designed to help professionals automate data preparation, cleaning, and reporting using Microsoft Excel Power Query. Participants will learn how to import data from multiple sources, transform messy datasets, combine files, automate repetitive tasks, and build refreshable reports without writing complex formulas or macros. The training is highly practical and hands-on, using real-world business scenarios from Finance, HR, Sales, Procurement, and Operations. Learning Objectives By the end of this course, participants will be able to: Understand the Power Query workflow. Import data from multiple sources. Clean and transform large datasets efficiently. Merge and append multiple tables. Create automated data transformation processes. Build reusable and refreshable reports. Apply advanced Power Query transformations. Work with custom columns and conditional logic. Understand the basics of M Language. Reduce manual reporting effort through automation. Who Should Attend? This course is ideal for: Business Professionals Data Analysts MIS Executives Finance & Accounting Professionals HR Professionals Sales & Marketing Teams Operations & Supply Chain Professionals Anyone who spends significant time cleaning and preparing Excel data Day 1 – Power Query Fundamentals & Data Transformation Module 1: Introduction to Power Query What is Power Query? Benefits of Power Query Power Query Interface Understanding Queries & Connections Data Refresh Concepts Module 2: Importing Data Excel Files CSV Files Text Files Folder Import PDF Files Web Data SQL Server (Introduction) SharePoint Files (Introduction) Module 3: Data Cleaning Techniques Remove Blank Rows Remove Duplicates Trim & Clean Text Change Data Types Split Columns Merge Columns Fill Down & Fill Up Replace Values Rename Columns Remove Errors Module 4: Data Transformation Sorting & Filtering Group By Pivot Columns Unpivot Columns Transpose Data Extract Text Date Transformations Number Transformations Conditional Columns Custom Columns Module 5: Combining Data Append Queries Merge Queries Join Types Expand Tables Combining Multiple Excel Files from a Folder Creating Automated Monthly Reports Day 2 – Automation, Advanced Features & Business Applications Module 6: Advanced Power Query Query Dependencies Managing Applied Steps Query Parameters Reference vs Duplicate Queries Function Queries Error Handling Performance Optimization Module 7: Introduction to M Language Understanding Formula Bar M Language Basics Common M Functions Editing Existing Code Creating Simple Custom Functions Module 8: Data Automation Automatic Data Refresh Refresh All Queries Dynamic File Paths Refreshing Folder-Based Reports Building Repeatable Reporting Processes Module 9: Power Query Best Practices Naming Conventions Query Organization Performance Tips Documentation Troubleshooting Common Errors Module 10: Real-World Business Projects HR Employee Master Cleanup Sales Data Consolidation Financial Report Automation Procurement Data Analysis Customer Database Cleaning Monthly MIS Automation Hands-on Case Studies & Practice Training Deliverables Participants will receive: Training Material / Course Manual Practice Files & Exercises Power Query Sample Datasets Power Query Cheat Sheet M Language Quick Reference Guide Certificate of Completion Post-Training Support & Q&A
Excel VBA Report Automation Training
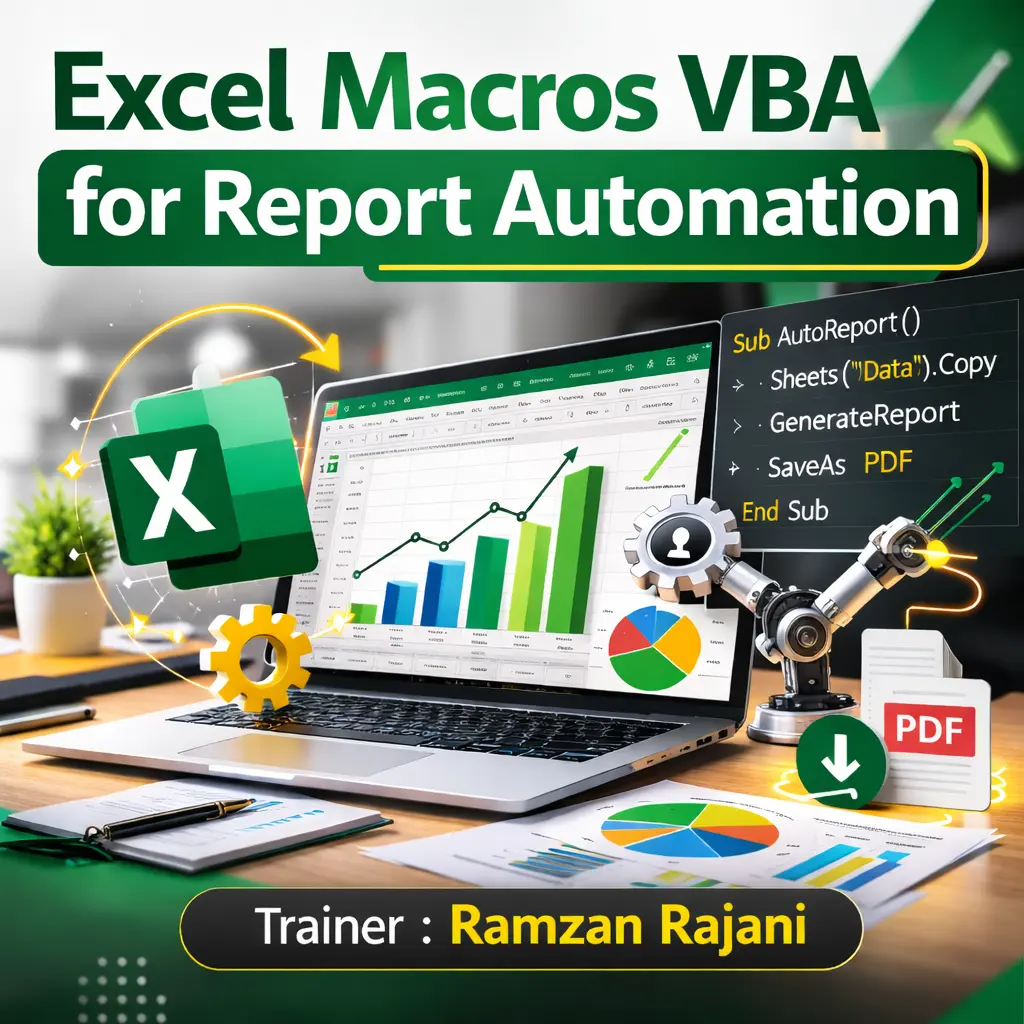
Course Details Course Outline Training Deliverables Course Description This Excel VBA Report Automation Training course is designed to help professionals automate repetitive Excel tasks, streamline reporting processes, and improve productivity using Visual Basic for Applications (VBA). Participants will learn how to record macros, write VBA code, automate reports, manipulate worksheets, work with Excel objects, and build user-friendly automation solutions. The training is highly practical and project-based, enabling participants to automate daily, weekly, and monthly reports using real-world business scenarios from Finance, HR, Sales, Operations, and MIS reporting. Learning Objectives By the end of this course, participants will be able to: Understand VBA programming concepts and the Excel Object Model. Record, edit, and optimize Macros. Write VBA procedures and functions. Automate repetitive reporting tasks. Create dynamic and reusable report automation solutions. Work with worksheets, workbooks, ranges, and tables using VBA. Automate data import, formatting, and report generation. Create interactive UserForms for data entry. Handle errors and debug VBA code efficiently. Build professional report automation projects that save significant manual effort. Who Should Attend? This course is ideal for: Business Professionals MIS Executives Data Analysts Finance & Accounting Professionals HR Professionals Operations Teams Reporting Analysts Business Analysts Anyone who prepares repetitive Excel reports and wants to automate them using VBA Day 1 – VBA Fundamentals & Macro Automation Module 1: Introduction to VBA What is VBA? Benefits of Report Automation Excel Developer Tab VBA Editor (VBE) Understanding the Excel Object Model Modules & Procedures Module 2: Recording & Editing Macros Recording Macros Absolute vs Relative References Editing Recorded Code Assigning Macros to Buttons Macro Security Settings Personal Macro Workbook Module 3: VBA Programming Basics Variables & Constants Data Types Operators InputBox & MsgBox Comments Naming Conventions Module 4: Decision Making & Loops If…Then…Else Select Case For…Next Loop For Each Loop Do While & Do Until Nested Loops Module 5: Working with Excel Objects Workbooks Worksheets Ranges Cells Rows & Columns Named Ranges Excel Tables (ListObjects) Day 2 – Report Automation & Advanced VBA Module 6: Automating Excel Reports Importing Data Automatically Cleaning & Formatting Data Copying Data Between Worksheets Creating Summary Reports Updating Pivot Tables Refreshing Power Query Reports Exporting Reports to PDF Module 7: Working with Files & Folders Open & Close Workbooks Save As Automation Batch Processing Multiple Files Folder Selection Dialog Creating New Reports Automatically Renaming Files Module 8: UserForms & Interactive Automation Creating UserForms Text Boxes Combo Boxes List Boxes Command Buttons Input Validation Navigation Forms Module 9: Error Handling & Code Optimization On Error Statements Debugging VBA Code Immediate Window Breakpoints Error Logging Writing Efficient VBA Code Best Practices Module 10: Real-World Automation Projects Monthly Sales Report Automation HR Employee Report Automation Finance MIS Automation Dashboard Refresh Automation Bulk PDF Report Generation Email Reports via Outlook Automation End-to-End Report Automation Project Hands-on Practice & Case Studies Training Deliverables Participants will receive: Training Material / Course Manual VBA Practice Files & Exercises Ready-to-Use VBA Code Library Report Automation Templates Excel VBA Cheat Sheet VBA Object Model Reference Guide Certificate of Completion Post-Training Support & Q&A